
This article is a follow up to our earlier post Unlock Lightning-Fast Data Insights with Observable Notebooks! However, notebooks are not ideal communication tools for dashboards or interactive apps for users. It is critical to know your audience and choose the right tools and methods that will communicate effectively.
Enter Observable Framework, a static site generator for building interactive dashboard apps to help teams communicate more effectively with data.
While Observable notebooks are a quick and straightforward approach to exploring data, the Observable Framework is a static site generator for building interactive dashboard apps. You give it a mixture of Markdown and JavaScript (and potentially other languages too) and it compiles them all together into fast loading interactive pages which can be shared with stakeholders.
Setting up
Observable Framework runs on Javascript, see https://observablehq.com/framework/getting-started
# Start a new project
# This command will ask you a series of questions in
# order to initialize your new project
$ npm init "@observablehq"


# Start the local server
$ npm run dev
    > dev
    > observable preview

    Observable Framework v1.9.0
    ↳ http://127.0.0.1:3000/
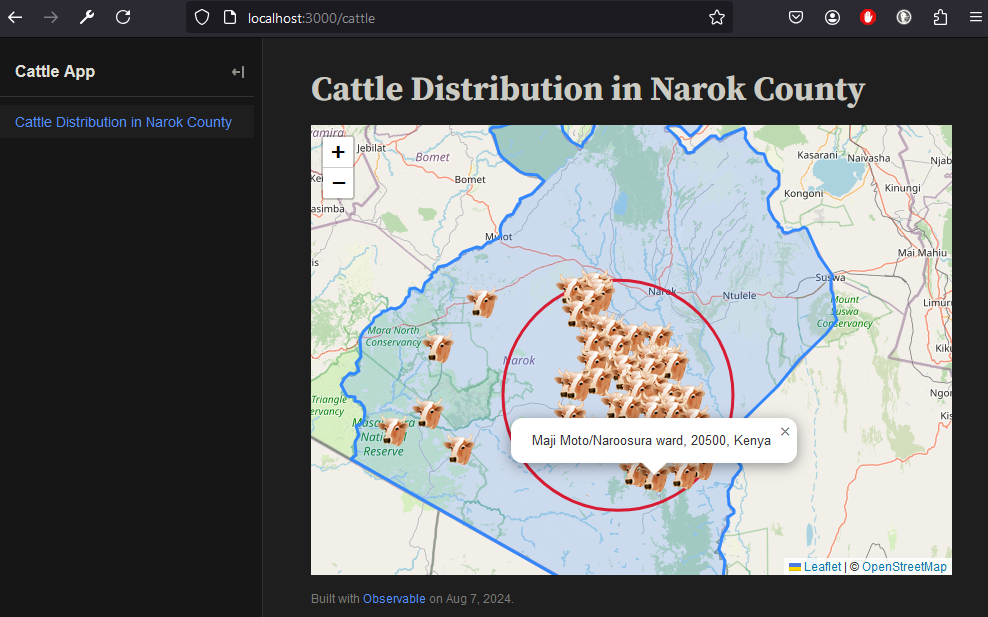
Here is the src/cattle.md file with Javascript inside markdown.
# Cattle Distribution in Narok County
<!--
Load required data
- places.json -> lat,lng,name
- narok.json -> arbitrary country boundaries
-->
```js
const cattleLocations = await FileAttachment("./places.json").json();
const narokGeoJson = await FileAttachment("./narok.json").json();
```
<!--
Map Operations -> Leaflet
-->
```js
const div = display(document.createElement("div"));
div.style = "height: 800px;";
const mapCentre = [-1.274043, 35.54945]
const map = L.map(div)
.setView(mapCentre, 10);
L.tileLayer("https://tile.openstreetmap.org/{z}/{x}/{y}.png", {
attribution: '© <a href="https://www.openstreetmap.org/copyright">OpenStreetMap</a>'
})
.addTo(map);
// Custom cow icon
const cattleIcon = L.icon({
iconUrl: 'https://www.iconarchive.com/download/i2178/aha-soft/agriculture/cow-head.48.png',
iconSize: [32, 32]
});
// Add a marker for each location
for (const loc in cattleLocations) {
const data = cattleLocations[loc]
L.marker([data.lat, data.lon], {
icon: cattleIcon
})
.addTo(map)
.bindPopup(data.name)
.openPopup();
}
// Circle highlighting area of focus
const circleCentre = [-1.374043, 35.74945]
var circleOptions = {
color: 'red',
fillColor: '#f03',
fillOpacity: 0
}
var circle = L.circle(circleCentre, 35000, circleOptions);
circle.addTo(map);
// Narok boundaries geojson
L.geoJSON(narokGeoJson).addTo(map);
```Results
Navigating to http://localhost:3000/cattle
Conclusion
- In Observable Framework, projects are just local files. You get to use your favorite editor, preview outputs locally and even work offline. You can host the projects anywhere.
- Observable Framework addresses the “last mile” challenge in data applications: data loading. Traditional dashboards often suffer from slow performance as they execute queries in real-time while users wait. In contrast, Observable Framework’s data loaders execute during the build process, ensuring pages load instantly.
- Additionally, since these data loaders run on your servers, you maintain control over privacy and security.
- You may also achieve the same using Dash on Jupyter environments https://dash.plotly.com/dash-in-jupyter
Read more at: